
一張好的圖表勝過千言萬語
資訊圖表 (Information graphics or infographics) 是將複雜的資訊、資料或知識,用視覺化的圖表,清楚快速的呈現方式。
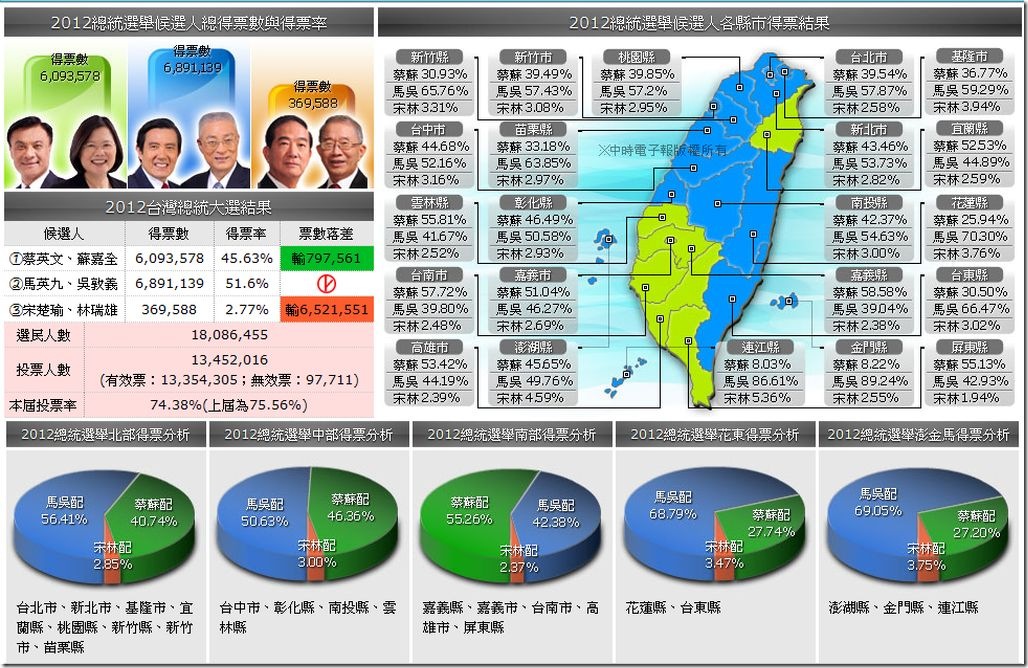
簡單的說,就是將繁複的數據或抽象的概念轉化為圖像,方便讀者快速掌握龐雜的訊息。

- 解讀訊息 (Interpreting information graphics):要傳達給讀者什麼樣的訊息
- 數據資料 (Elements of information graphics):資訊圖表所要呈現的資料、訊息或知識
- 視覺元素 (Visual devices):地圖、統計圖表、表格、流程圖.....
維基百科 Information graphics
資訊圖表範例網站:
GOOD Infographics
Cool Infographics
VizWorld
visual.ly


沒有留言:
張貼留言